
Figure 7.
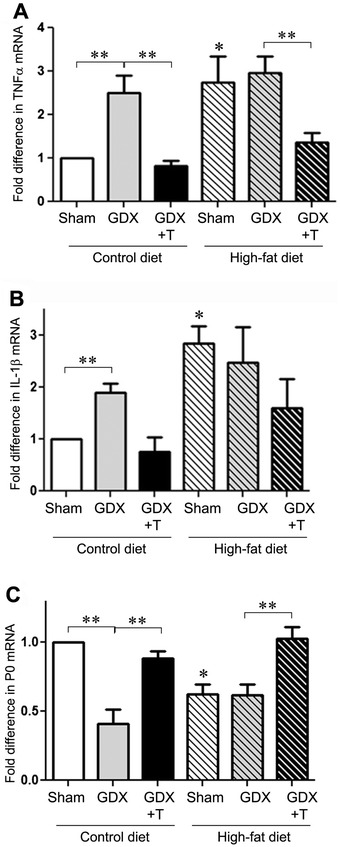
Low testosterone and high-fat diet increase proinflammatory cytokines TNFα and IL-1b mRNA and decrease myelin sheath marker P0 mRNA in sciatic nerve. (A) Quantitative real-time PCR data show the mean (±SEM) expression levels compared to the Sham control group for TNFα mRNA. (B) Quantitative real-time PCR data show the mean (±SEM) expression levels compared to the Sham control group for IL-1β mRNA. (C) Quantitative real-time PCR data show the mean (±SEM) expression levels compared to the Sham control group for P0 mRNA. All data are normalized with corresponding β-actin values. Statistical significance is based on ANOVA followed by Bonferroni. * P ≤0.05 between diet groups; ** P ≤0.05 between hormone groups; N ≥6.