
Fig. 3.
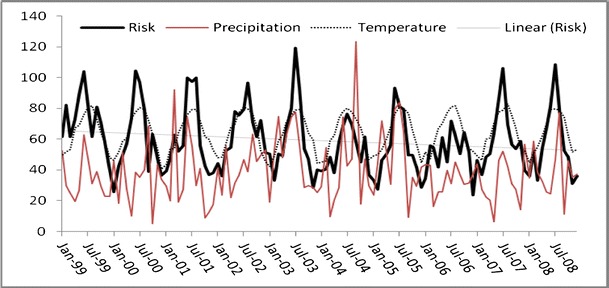
Risk (and linear trend) of campylobacteriosis (scale factor of 100), precipitation (scale factor of 10), and temperature in Georgia, USA from 1999 to 2008
Official websites use .gov
A
.gov website belongs to an official
government organization in the United States.
Secure .gov websites use HTTPS
A lock (
) or https:// means you've safely
connected to the .gov website. Share sensitive
information only on official, secure websites.
Risk (and linear trend) of campylobacteriosis (scale factor of 100), precipitation (scale factor of 10), and temperature in Georgia, USA from 1999 to 2008