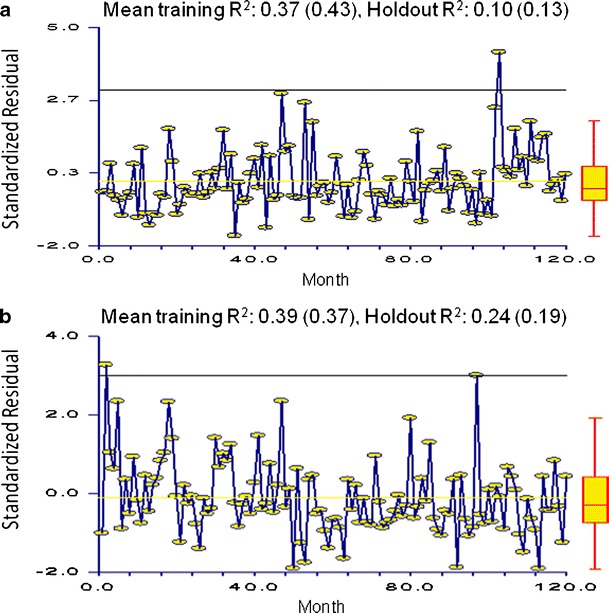
Fig. 5.

ARIMA (000 011) Control Charting and Moving holdout results for division 1 (a) and division 4 (b). Included are the standardized residual scatter plots and mean training and holdout R 2 results for moving holdout analyses using decomposition (compared with 2008 results). a Mean training R 2, 0.37 (0.43); holdout R 2, 0.10 (0.13). b Mean training R 2, 0.39 (0.37); holdout R 2, 0.24 (0.19)
