
Figure 6.
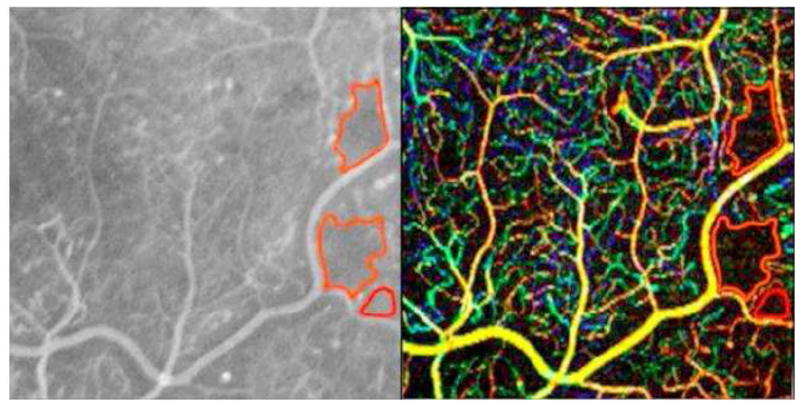
View of temporal retina in a patient with proliferative diabetic retinopathy. Fluorescein angiography (FA) on left shows multiple microaneurysms; regions of capillary non-perfusion outlined in red. 3 x 3 mm phase-contrast optical coherence tomography (PC-OCT) on right shows similarly shaped regions of capillary non-perfusion outlined in red. While some microaneurysms are shown by FA and PC-OCT (white circles), others are only shown in the FA image (blue circles) or PC-OCT (red circles).