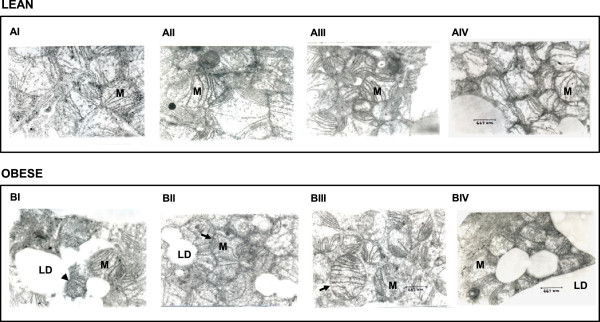
Figure 3.

Effect of vitamin A supplementation on BAT morphology. Five-month-old male lean (A) and obese (B) rats were fed vitamin A at a dose of 2.6 (I), 26 (II), 52 (III) and 129 (IV) mg/kg diet for a period of 20 weeks. AI served as the control group for lean phenotype, while BI was the control group for obese phenotype. The BAT samples were fixed, and sections were stained with uranyl citrate and lead citrate for morphologic analysis. Photomicrographs were taken at 15000x magnification. Scale bar, 667 nm. The ruptured membranes observed in obese group (BI) are depicted by arrow heads. The intact mitochondria in BII and BIII are depicted by arrow. M- mitochondria, LD- lipid droplet.
