Figure 1.

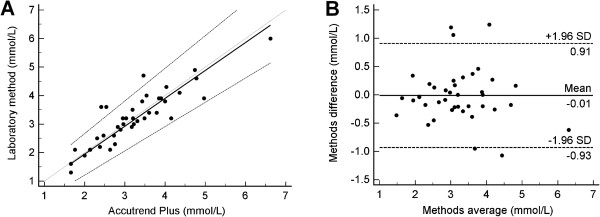
Graphs of comparison between methods. A. Passing Bablok regression plot for triglycerides determined on laboratory method and Accutrend® Plus. B. Bland Altman Plot for the difference between methods.

Graphs of comparison between methods. A. Passing Bablok regression plot for triglycerides determined on laboratory method and Accutrend® Plus. B. Bland Altman Plot for the difference between methods.