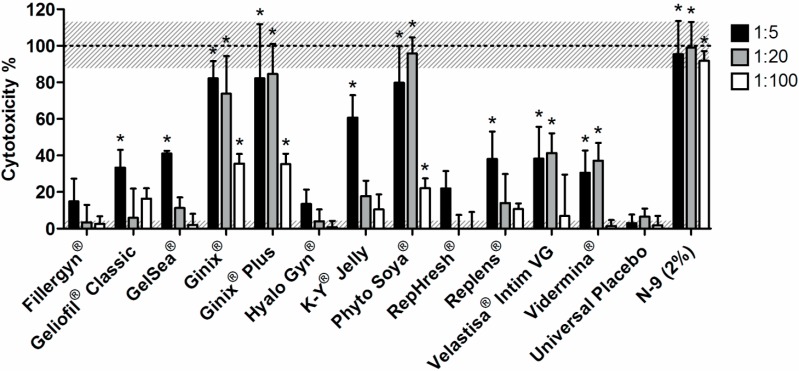
Figure 3.
Cytotoxicity of tested products to the HeLa cell line after 24 h incubation at 1:5, 1:20 and 1:100 dilution ratios in medium, as assessed by the LDH assay. Individual columns and vertical bars represent mean and SD values, respectively (n = 3). Horizontal dotted lines at 0% and 100% correspond to low and high controls, respectively (associated gray shades stand for SD values). (*) Denotes a significant difference (p ˂ 0.05) when comparing to cells incubated with the Universal Placebo at the same dilution ratio.

