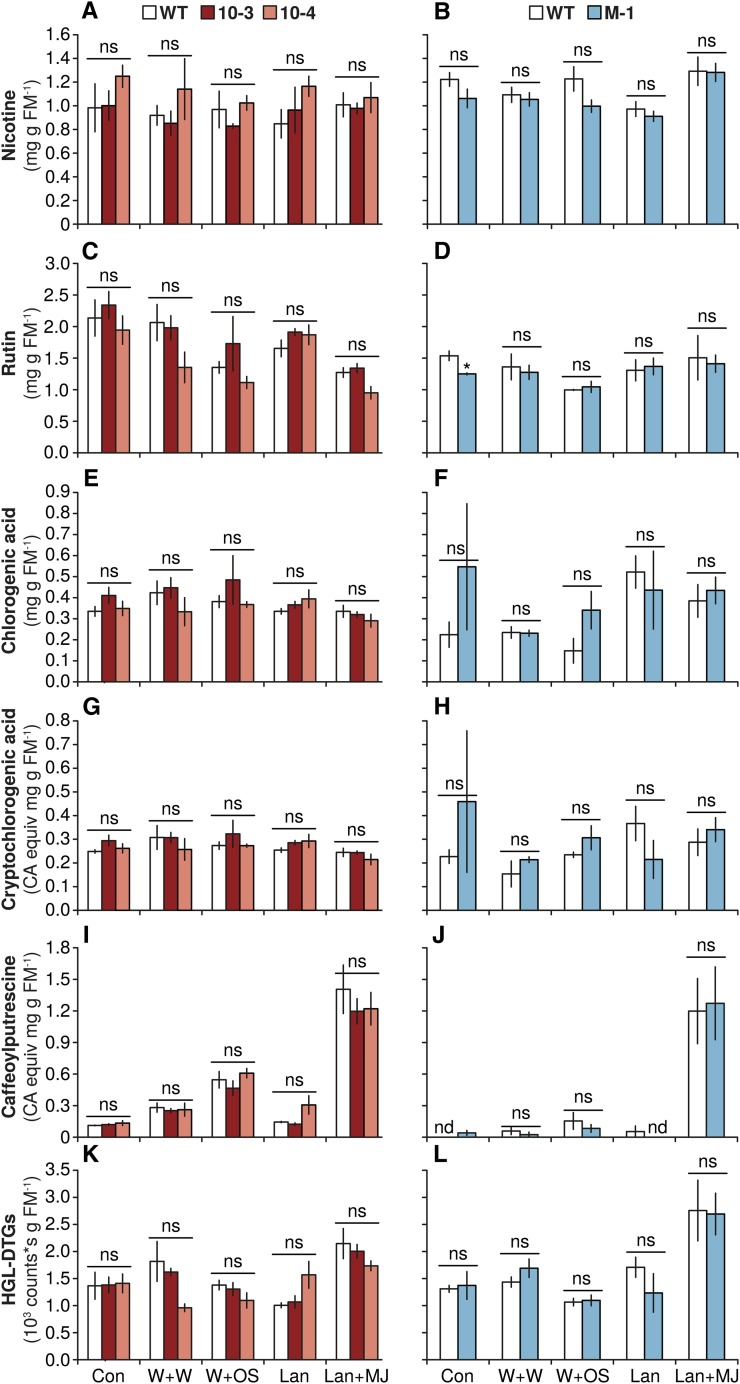
Figure 4.
Expression of TPS10 and TPS10M does not alter levels of defense metabolites constitutively or after elicitation (mean ± sem, n = 4). Data in A, C, E, G, I, and K and B, D, F, H, J, and L are from two separate experiments with elongated plants (legends are in A and B). Samples were taken from the 0 leaf (source to sink transition) 3 d after treatment to permit elicited metabolite synthesis and accumulation. Nicotine (A and B), rutin (C and D), CA (E and F), chryptochlorogenic acid (G and H), caffeoylputrescine (I and J), and total HGL-DTGs (K and L) were quantified after no treatment (Con) or treatment with W+W, W+OS, Lan, or Lan+MJ. Cryptochlorogenic acid and caffeoylputrescine were quantified as CA equivalents (CA equiv). Peak areas of individual HGL-DTGs are shown in Supplemental Tables S1 and S2. There were no other significant differences (P > 0.05) after Holm-Bonferroni correction of Welch’s t tests or Wilcoxon rank sum tests between lines and the wild type within each treatment (the wild type was tested two times versus lines 10-3 and 10-4; individual and total HGL-DTGs tested). FM, Fresh mass; nd, not detected; ns, not significant; WT, wild type. *, P < 0.05 in a Welch’s t test between line M-1 and the wild type in the Con treatment (rutin; D).

