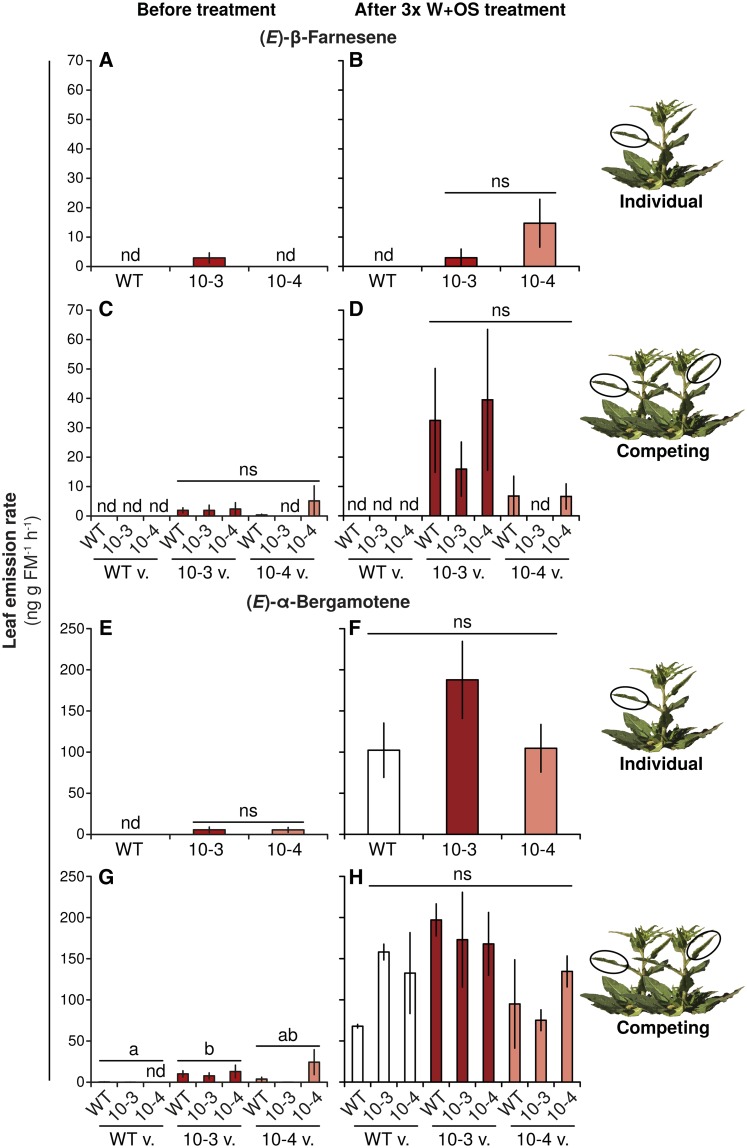
Figure 6.
Emission of (E)-α-bergamotene but not (E)-β-farnesene is as great from wild-type plants as from TPS10 lines after multiple elicitations, but neither volatile is affected by growth of plants in close competition with the wild type or TPS10 (mean ± sem, n = 4). The headspace around +2 leaves on plants, grown either alone or in competing pairs, was sampled for 6 h before treatment (A, C, E, and G) or 0 to 6 h after the last of three elicitations with W+OS over 18 h across 2 d (B, D, F, and H). Multiple elicitations were conducted so that differences in emission caused by either direct induction or priming of the induced response could be amplified and detected. (E)-β-farnesene (A–D) and (E)-α-bergamotene (E–H) emission rates are shown here, whereas PCA analyses of nontarget volatiles measured in the same samples are shown in Supplemental Figure S4. Different letters indicate significant differences (P < 0.05) in Wilcoxon rank sum tests or Welch’s t tests between lines after significant Kruskal-Wallis tests and after Bonferroni corrections for multiple testing (P > 0.05). FM, Fresh mass; nd, not detected; ns, not significant; v., versus; WT, wild type.

