
Figure 4.
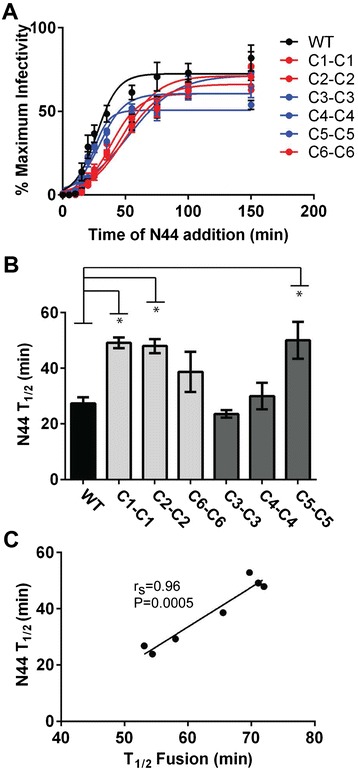
Resistant Envs do not lose susceptibility to inhibition by N44 faster than WT. (A) Percent infectivity of pseudovirus on U87-CD4-CCR5 cells after addition of N44 at different time points. (B) Calculated T1/2 of N44 susceptibility from time of addition experiments in (A). (C) Scatter plot correlating the T1/2 of N44 susceptibility and the T1/2 of fusion (Figure 3). *unpaired t-test indicates P values <0.05 showing longer time of susceptibility compared to WT. Linear regression and statistics for correlation is indicated. rs, Spearman correlation coefficient.