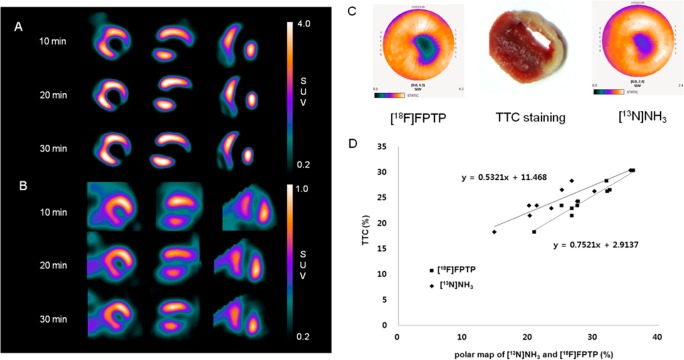
Figure 3.
Short-, vertical long-, and horizontal long-axis images of (A) [18F]FPTP or (B) [13N]NH3 in LCA-occluded rats. Data were collected 10, 20, and 30 min after radiotracer injection (37 MBq). Sharply defined myocardial deficits were identified with [13N]NH3 or [18F]FPTP labeling in LCA-occluded rats, whereas live uptake was observed in [13N]NH3 images. (C) Polar map image of [18F]FPTP or [13N]NH3 and corresponding myocardial slices stained with TTC. (D) Correlation between infarct size measured using small-animal PET and TTC staining. A threshold of 60% was set for the PET data analysis. Correlation coefficient [18F]FPTP, r = 0.89, P < 0.01; [13N]NH3, r = 0.84, P < 0.01.

