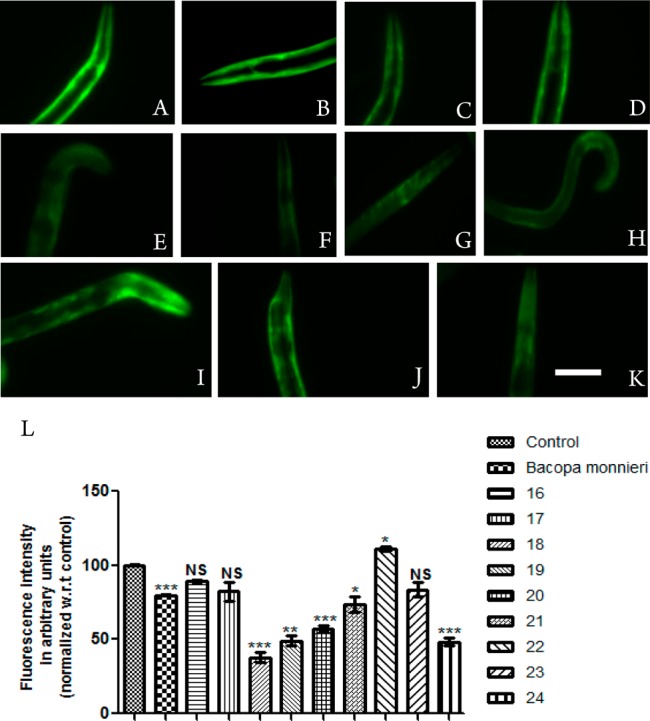
Figure 2.

α-Synuclein aggregation in NL5901 strain of C. elegans treated with OP50 (A), Bacopa monnieri (B), 16 (C), 17 (D), 18 (E), 19 (F), 20 (G), 21(H), 22 (I), 23 (J), and 24 (K). Scale bar, 50 μm. (L) Graphical representation for fluorescence intensity of aggregation of the nematodes as quantified using ImageJ software. *p < 0.05, **p < 0.01, ***p < 0.001, and NS, not significant.
