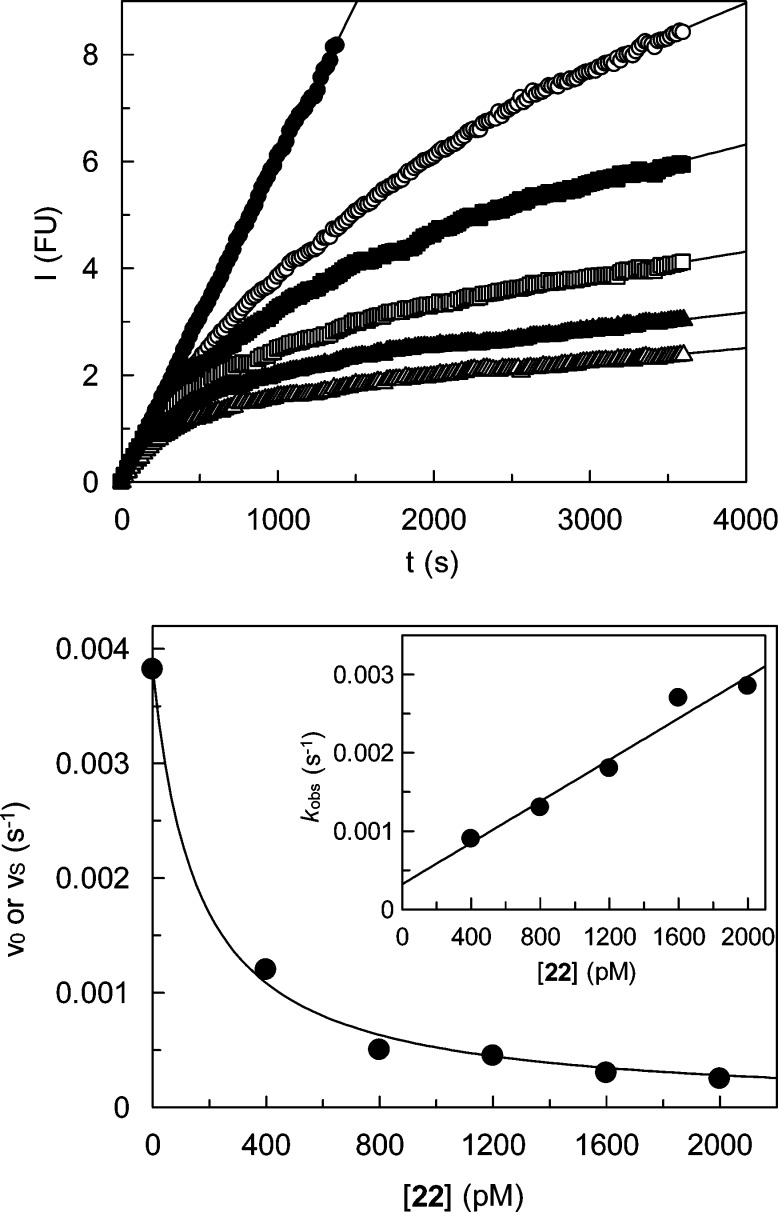
Figure 2.
Inhibition of human cathepsin K by 22. Top: Monitoring of the cathepsin K-catalyzed hydrolysis of Z-Leu-Arg-AMC in the presence of increasing concentrations of compound 22 (closed circles, 0 pM; open circles, 400 pM; closed squares, 800 pM; open squares, 1200 pM; closed triangles, 1600 pM; open triangles, 2000 pM). Fluorescence emission at 440 nm was measured after excitation at 360 nm. Bottom: Plot of the rates obtained in duplicate measurements versus concentrations of 22. Nonlinear regression gave an IC50 value of 158 (±14) pM. Inset: Plot of the first-order rate constants kobs versus concentrations of 22. Linear regression gave a value kon/(1 + [S]/Km) of 1.33 (±0.15) × 10–6 pM–1 s–1.

