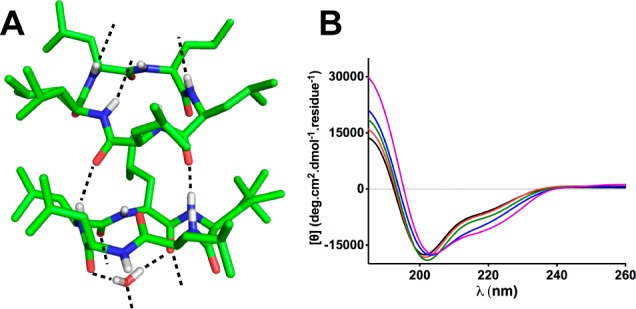
Figure 2.

Aggregation of compound 1. (A) Crystal structure of 1 isolated from MeOH/H2O (80:20), showing intermolecular hydrogen bonds (dashes) (CCDC 1002286). (B) Concentration-dependent CD spectra of 1 (30 μM, purple; 60 μM, blue; 150 μM, green; 250 μM, red; 500 μM, black) in TFE at 298 K.
