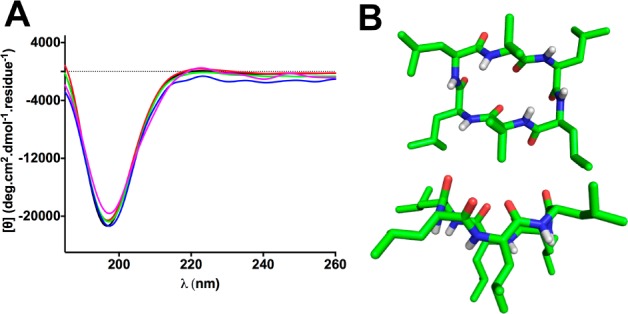
Figure 3.

(A) Concentration-independent CD spectra for 3 in TFE (30 μM, purple; 60 μM, blue; 150 μM, green; 250 μM, red; 500 μM, black; 298 K). (B) NMR-derived structure of 3 in DMSO-d6. Top and side views show two Leu side chains approaching closely to prevent intermolecular amide H-bonds.
