
Figure 5.
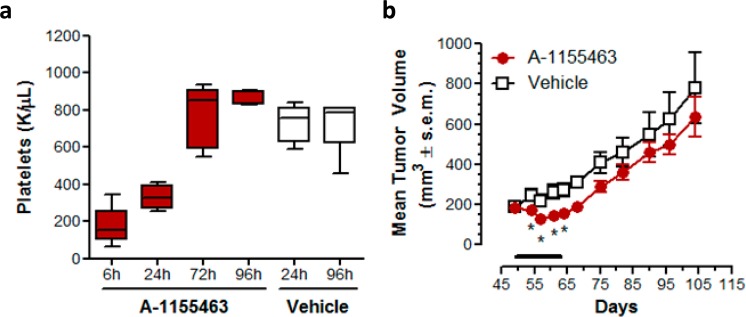
(a) Kinetics of platelet reduction and rebound following a single IP dose of A-1155463 in SCID-Beige mice. Nontumor bearing female SCID-Beige mice were treated with a single dose of A-1155463 (5 mg/kg, IP). Blood samples were collected by means of retro-orbital bleeds at regular time intervals. The number of platelets was plotted as a function of time. Each point reflects the average of 5 biological replicates. Each box indicates the median ± SEM. The error bars reflect minimum and maximum values (n = 5 per time point). The colored boxes represent upper and lower quartiles. The horizontal lines within each colored box represent the mean, and the whiskers are the upper and lower range. (b) Inhibition of H146 SCLC xenograft growth by A-1155463. Female SCID-Beige mice bearing NCI-H146 subcutaneous xenografts were treated with A-1155463 (5 mg/kg IP, QDx14) or an equal volume of the vehicle (5% DMSO, 10% EtOH, 20% Cremophor ELP, and 65% D5W; n = 5 per time point) and changes in tumor volume determined as a function of time. Each point reflects the average volume of 5 tumors. Points with significant (Student’s t test, p < 0.05) difference between treated and untreated groups are indicated by means of asterisks. Tumor volume was calculated by W2·L·0.5 where W and L are two perpendicular diameters indicating width and length, respectively.