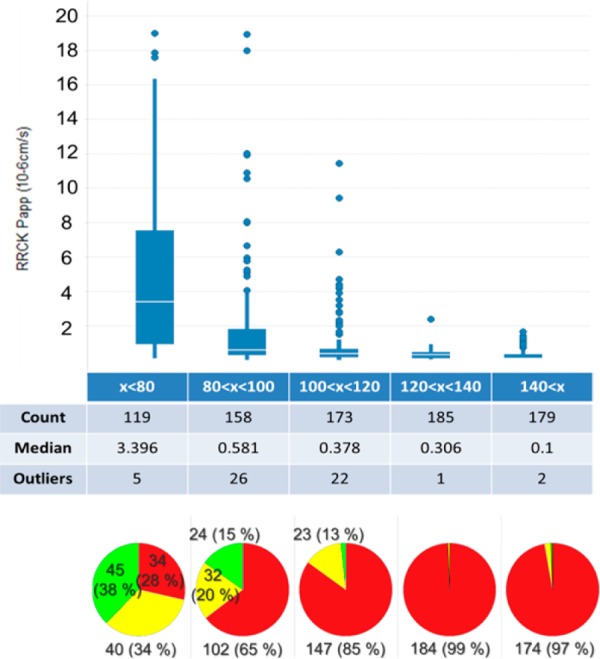
Figure 5.

Statistical box-and-whisker plot analysis of RRCK permeability vs binned EPSA, and pie charts of the same data set. (Color coding by permeability assessed by RRCK; cutoffs: Papp < 1 × 10⁻⁶ cm/s, not permeable (red); 1 × 10⁻⁶ cm/s < Papp < 5 × 10⁻⁶ cm/s, moderately permeable (yellow); Papp < 5 × 10⁻⁶ cm/s, permeable (green).
