
Figure 3.
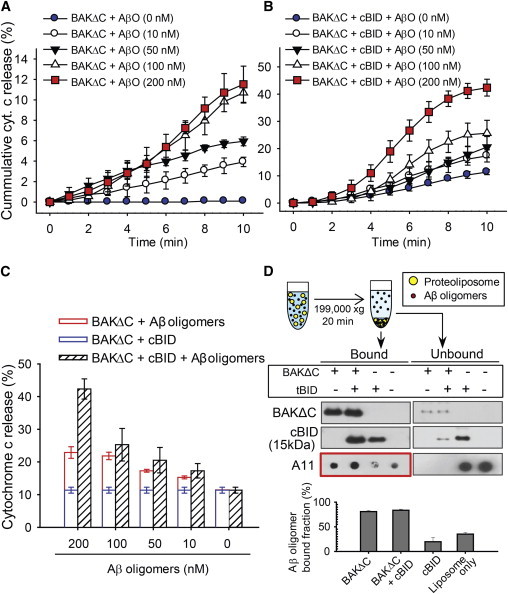
Cytochrome c release via Aβ oligomer-induced apoptotic BAK pores. (A) The cumulative histogram of cytochrome c release when treated with the indicated concentrations of Aβ oligomers and 40 nM BAKΔC observed for 10 min. The data represent the mean ± SD of five independent experiments. (B) Cofloatation assay of Aβ oligomers interaction with proteoliposomes. Liposomes treated with BAKΔC and/or cBID mixed with/without Aβ oligomers, and precipitated with high-speed centrifugation. The amount of vesicle-bound Aβ oligomer was quantified by Dot blot. The data represent the mean ± SD of three independent experiments. The quantification of the bound levels of Aβ oligomers (red box) was performed with the software QUANTITY ONE (Bio-Rad). (C) The cumulative histogram of cytochrome c release when treated with the indicated concentrations of Aβ oligomers 40 nM BAKΔC and 40 nM cBID, observed for 10 min. (D) Total cytochrome c release histogram of the indicated concentrations of Aβ oligomers 40 nM BAKΔC and 40 nM cBID, compared to the sum of 40 nM BAKΔC, 40 nM cBID, 40 nM BAKΔC Aβ oligomers (indicated concentration) after 10 min. Data in panels C and D represent the mean ± SD of five independent experiments. Concentrations are given in moles of monomeric Aβ. To see this figure in color, go online.