
Figure 5.
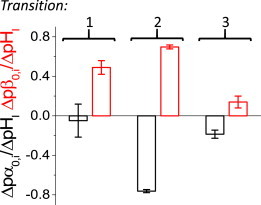
Rate coefficient pHI-dependence. To access pHI-dependence of the rate coefficients, a linear regression (Fig. 4, red lines) of the log10 of α0,i and β0,i values (pα0,i and pβ0,i, respectively) as a function of the pHI was calculated and the slope of the regression (Δpα0,i/ΔpHI and Δpβ0,i/ΔpHI, respectively) were taken as indices of pHI-sensitivity. In this figure the average values for slope are plotted for each forward and backward transition. All values were statistically different (p < 0.05). To see this figure in color, go online.