
Figure 9.
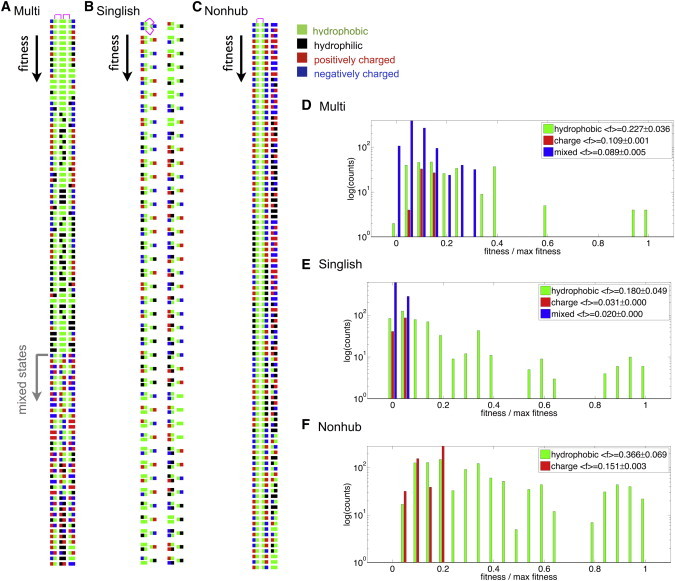
Results using a simplified 1D model. (A–C) The top 80 configurations for Multi (A), Singlish (B), and Nonhub systems (C). Configurations are arranged vertically according to their fitness (highest fitness at the top). For each system, functional interactions are indicated in magenta for the top configuration. Hydrophobic surfaces are shown in green, hydrophilic in black, positively charged in red, and negatively charged in blue. (D–F) Histograms of the number of configurations (in log scale) corresponding to a certain relative fitness (fitness divided by maximal fitness) are shown for Multi (D), Singlish (E), and Nonhub systems (F). The configuration count is divided for all hydrophobic functional contacts (green), all electrostatic functional contacts (red), and one hydrophobic and one electrostatic contact (blue; not available for the Nonhub system). Mean ± variance values of the distributions are indicated in the legend. To see this figure in color, go online.