
Figure 2.
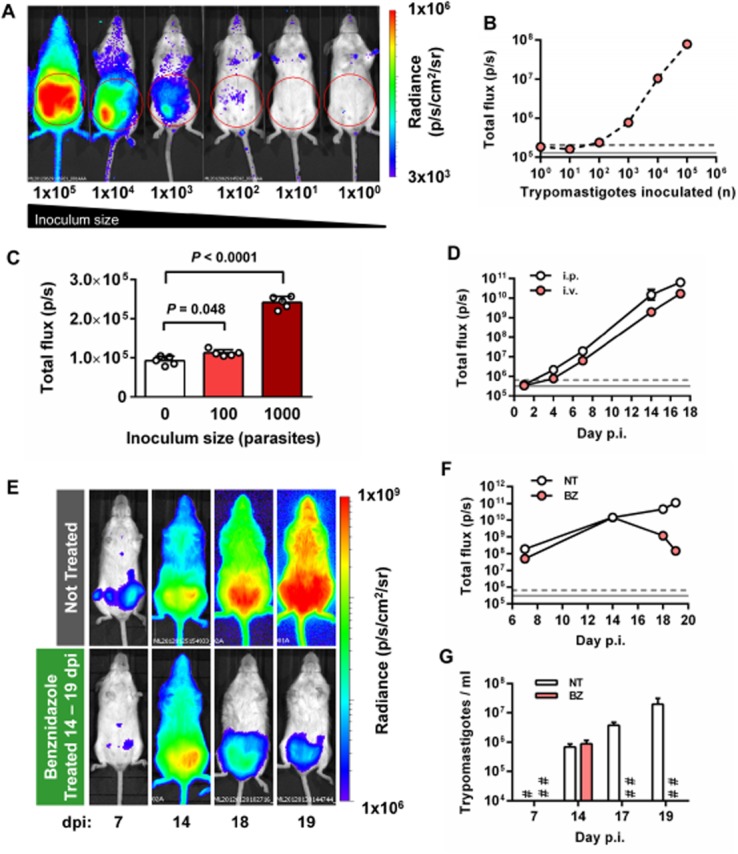
Evaluation of T. cruzi infection in SCID mice by in vivo bioluminescence imaging.A and B. Evaluation of in vivo limit of parasite detection.
- Representative ventral images of SCID mice 1 h after i.p. injection with 1 × 100-1 × 10⁵ blood trypomastigotes (BTs) of PpyRE9h luciferase-expressing T. cruzi. Pseudocolour heat-maps indicate intensity of bioluminescence from low (blue) to high (red). All images use the same log10 scale heat-map, minimum and maximum radiance values as indicated. Red circles indicate regions of interest (ROI) used for signal quantification.
- Quantification of abdominal bioluminescence for mice in the experiment illustrated in A.
- Abdominal bioluminescence for mice 1 h after i.p. injection with 0, 100 or 1000 BTs (means ± SD, circles indicate values for individual animals, n = 5 per group). P-values shown are for one-way anova comparisons between infected groups and the uninfected control group.
- Whole animal total ventral bioluminescence for SCID mice inoculated via i.p and i.v. routes (data are means ± SD, n = 3 per group).
- Example ventral view images of the same individual SCID mouse 7, 14, 18 and 19 days after i.p. injection with 1 × 10³ BTs (upper panels) and comparison with an equivalent infected mouse treated with 100 mg kg−1 day−1 benznidazole (BZ) for 5 days starting at 14 dpi (lower panels). All images use the same log10 scale heat-map with minimum and maximum radiance values as indicated.
- Whole animal total ventral bioluminescence for mice in the experiment represented in E (data are means ± SD, n = 3 per group, one experiment). BZ, benznidazole treated; NT, not treated.
- Microscopy-based quantification of peripheral parasitaemia for animals in the experiment represented in E (means ± SD, n = 3 per group); limit of detection = 2 × 10⁴ ml−1. #, NT below detection limit; ##, BZ below detection limit.B, D and F. Grey lines indicate detection thresholds determined as the mean (solid line) and mean +2SDs (dashed line) of background luminescence of control uninfected mice using abdominal (B) or whole animal (D, F) ROI.