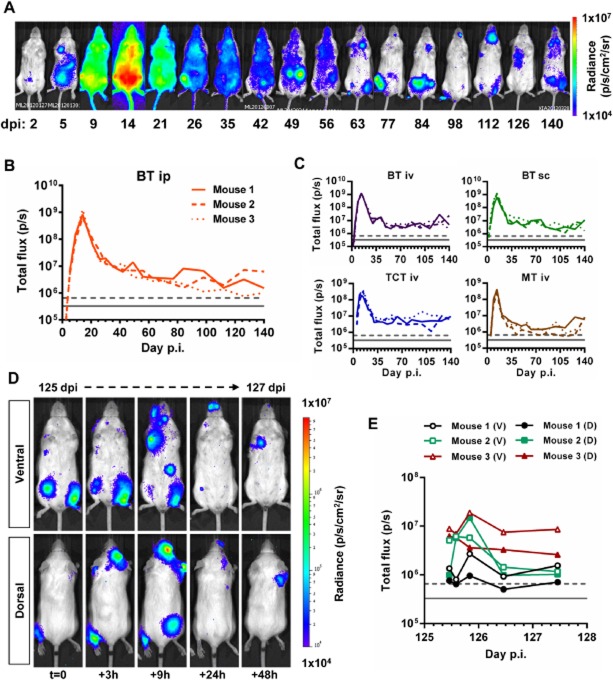
Figure 3.
- Representative ventral view images of the same BALB/c mouse taken at sequential time points over the course of 140 days after i.p. inoculation with 1 × 10³ PpyRE9h luciferase-expressing T. cruzi CL Brener blood trypomastigotes (BT) (representative of n = 3–6 per experiment). Heat-maps are on log10 scales and indicate intensity of bioluminescence from low (blue) to high (red); the minimum and maximum radiances for the pseudocolour scale are indicated.
- Quantification of whole animal total ventral bioluminescence for three individual mice from the experiment represented by the images in A. Grey lines indicate detection thresholds determined as the mean (solid line) and mean +2SD (dashed line) of background luminescence of control uninfected mice.
- Quantification of whole animal total ventral bioluminescence of mice inoculated with 1 × 10³ BTs, tissue culture trypomastigotes (TCT) or metacyclic trypomastigotes (MT) via i.p., i.v. or s.c. routes. Data are shown for three individual mice per group. Grey lines indicate detection threshold limits determined as in B.
- Paired ventral and dorsal view images of the same individual chronically infected mouse imaged at increased frequency over a 48 h period starting on day 125 pi (representative three mice per experiment). Heat-maps are on log10 scales and indicate intensity of bioluminescence from low (blue) to high (red); the minimum and maximum radiances for the pseudocolour scale are indicated.
- Quantification of total ventral (V) and dorsal (D) bioluminescence for three individual animals represented by images in D. Grey lines indicate detection threshold limits determined as in B.

