
Figure 6.
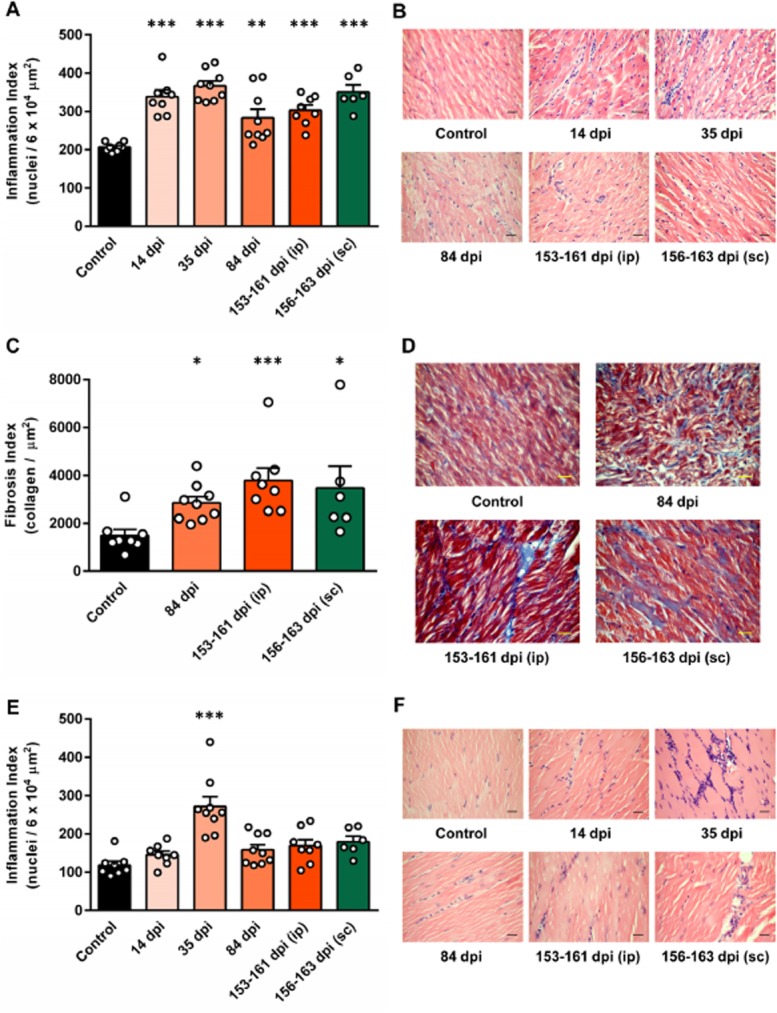
Histological evidence for chronic cardiac inflammation and fibrosis in T. cruzi infected BALB/c mice. Cardiac and skeletal muscle samples were obtained at acute and chronic stages of infection after inoculation with 1 × 10³ trypomastigotes via i.p. [14 (n = 8), 35 (n = 9), 84 (n = 9) and 153–161 (n = 8) dpi] or s.c. [156–163 dpi only (n = 6)] injection and from uninfected control mice (n = 8) from the same cohorts as the 153–163 dpi animals, then processed for histopathological analysis.
- Quantitative analysis of myocarditis. The level of cellular infiltration into cardiac muscle was assessed by automated counting of the number of nuclei in haematoxylin-eosin stained cardiac muscle sections from T. cruzi infected and uninfected control mice to derive an inflammation index (nuclei per 6 × 104 μm2).
- Representative images of cardiac muscle from mice at different stages of infection compared with uninfected controls (haematoxylin-eosin stain).
- Quantitative analysis of cardiac fibrosis. The level of fibrosis in cardiac muscle was assessed by automated counting of the area of collagen (blue) in cardiac muscle sections stained with Masson's trichrome from T. cruzi infected and uninfected control mice to derive a fibrosis index (collagen per μm2).
- Representative images of cardiac muscle from mice at different stages of infection compared with uninfected controls (Masson's trichrome stain).
- Quantitative analysis of skeletal muscle inflammation. The level of cellular infiltration into skeletal muscle was assessed as for cardiac muscle.
- Representative images of skeletal muscle from mice at different stages of infection compared with uninfected controls (haematoxylin-eosin stain).
A, C and E. Data are the means + SEM of six to nine mice per time point pooled from two independent experiments (n ≥ 3 mice per time point per experiment); circles indicate values for individual animals. Asterisks indicate P-values for one-way anova (A, E) or Kruskal–Wallis (C) comparisons between infected groups and uninfected control groups (&P < 0.05; &&P < 0.01; &&&P < 0.001).