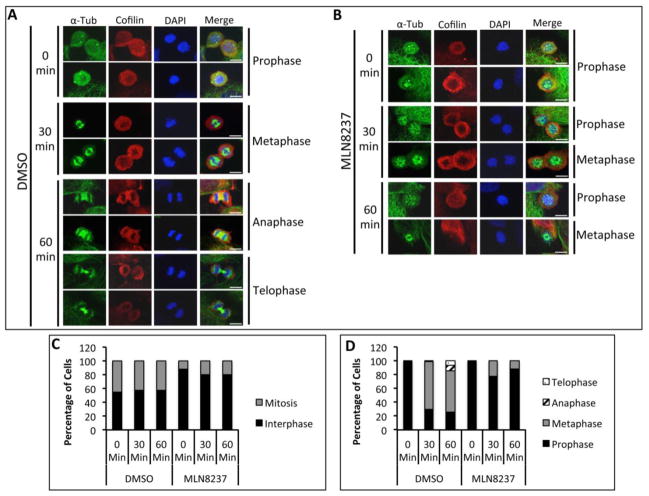
Figure 8. Treatment with Aur-A Inhibitor Delayed Progression of Cells Through Prophase.
Immunofluorescence analysis of DMSO (A) or MLN8237 (100nM) (B) treated and nocodazole synchronized M12 cells released into mitosis for 0, 30, or 60 mins. α-tubulin (green) and Cofilin (red) were visualized by staining with anti-α-tubulin and anti-Cofilin antibodies. DNA was stained with DAPI (blue). Mitotic cells presented are enlarged images from Supplemental Figure 4. C: Quantitation of the percent of cells in interphase or mitosis. Data shows average numbers of cells counted in 20 fields each from two separate experiments. D: Quantitation of the percent of cells in each mitotic phase. Data shows average numbers of cells counted in 20 random fields each from two separate experiments. Scale bar: 5μm.

