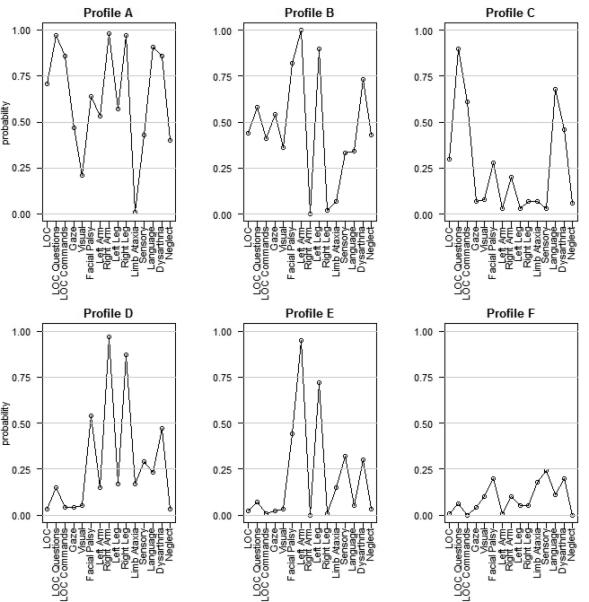
Figure 1.

rNIHSS profile patterns: probability of observing an abnormal response for each rNIHSS element by profile
Footnote:
LOC = Level of consciousness.
The 15 rNIHSS items are noted on the x-axis.
The probability of an abnormal score (≥1) for each of the 15 rNIHSS items is shown on the y-axis.
