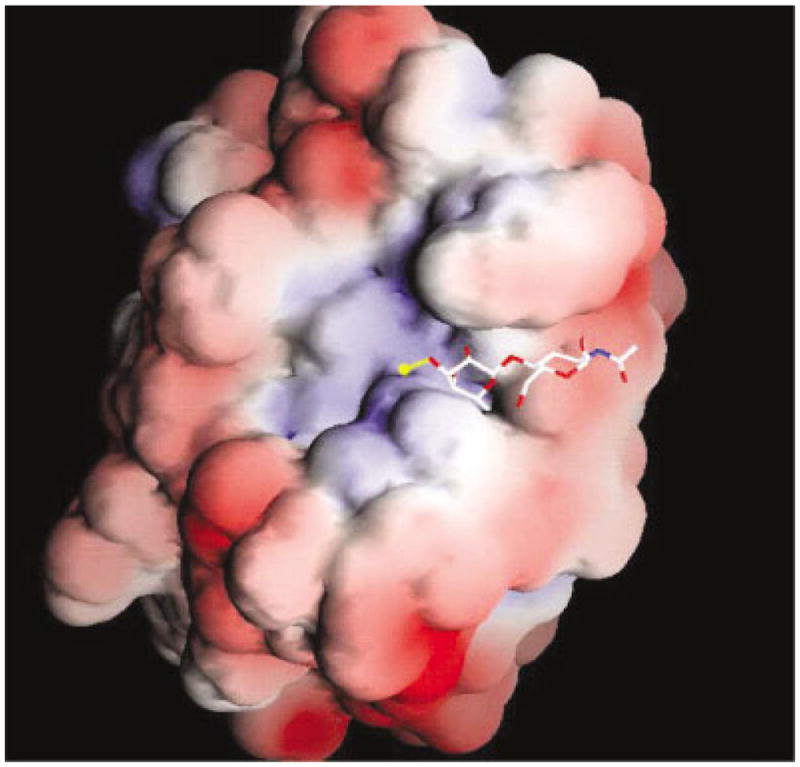
Fig. 4.

GRASP representation of the electrostatic potential of galectin-1 mapped onto the solvent accessible surface. Regions of positive potential are shown in blue, and negative potential is shown in red. The values set for the coloring scale are −3.6 and +3.7 kbT, respectively. LacNAc is shown in stick form. The sulfate, found at the nonreducing terminus, is shown in yellow.
