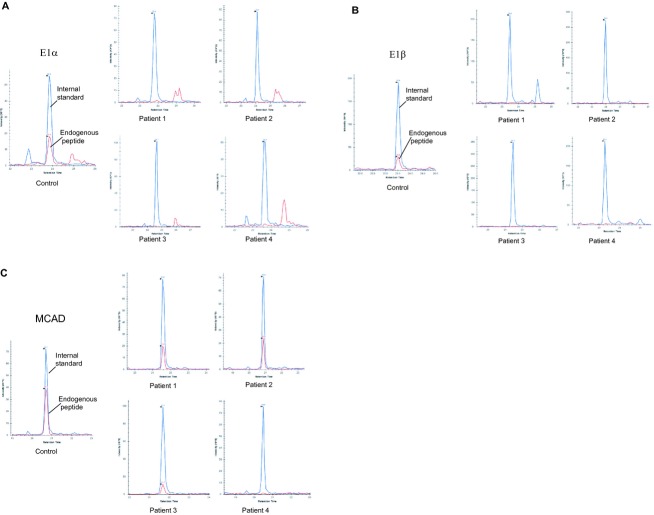
Figure 2.
Analysis of samples by SRM. Extracted chromatograms derived from the injection of peptide extracts are shown, where the blue color corresponds to the internal standard (heavy-labeled peptides) and the red color to the endogenous peptide. For quantification purposes the ratio endogenous peptide to internal standard was used. The y-axis corresponds to the intensity and the x-axis to the retention time. (A) Representative peptide analysis corresponding to the E1α (BCKDHA) subunit of the BCKDH complex. The peptide VDGNDVFAVYNATK was detected and quantified in the samples from healthy individuals (chromatogram on the left), but not in the samples from patients (chromatograms on the right). The detection level for the E1α subunit was determined as 23% respect to controls, so the E1α subunit levels in the samples from patients are below 23%. (B) Representative peptide analysis corresponding to the E1β (BCKDHB) subunit of the BCKDH complex. The peptide LGVSCEVIDLR was detected and quantified in the samples from healthy individuals (chromatogram on the left), but not in the samples from patients (chromatograms on the right). The detection level for the E1β subunit was determined as 19% respect to controls. Therefore, the E1β subunit levels in the samples from patients are below 19%. (C) Representative peptide analysis corresponding to the MCAD (ACADM) protein. The peptide IYQIYEGTSQIQR was detected and quantified in the samples from healthy individuals (chromatogram on the left) and in patients 1, 2, and 3, but not in the samples from patient 4. The detection level for the MCAD protein was determined as 9% respect to controls. Thus, the MCAD protein levels in the sample from patient 4 are below 9%. Two different healthy individuals were analyzed with three biological replicates for each of them. The detection levels for each protein were determined from the background noise in all control samples (n = 12).

