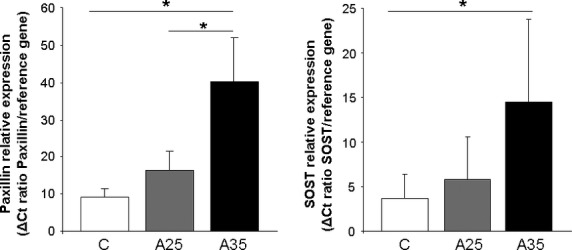
Fig. 11.

Paxillin and sclerostin mRNA expression in right tibia in control (C) rats and in both alcohol-fed (A25 and A35) rats (n = 8 in C group, n = 8 in A25 group, n = 10 in A35 group for paxillin mRNA and n = 9 in C group, n = 11 in A25 group, n = 10 in A35 group for sclerostin mRNA). Total RNA was extracted from frozen bone tissue and analysed by RT-QPCR as described in materials and methods. Paxillin mRNA expression in the A25 group was not significantly different from control group, but was higher in the A35 group compared with A25 and control groups (A35: 39.2 ± 12.1 versus A25: 16.4 ± 5.2, P < 0.05; and A35: 39.2 ± 12.1 versus C: 9.12 ± 2.23, P < 0.05). Sclerostin mRNA expression was higher in the A35 group compared with the control group: A35: 20.8 ± 9.34 versus C: 3.23 ± 2.59, P < 0.05. * indicates a significant difference (P < 0.05).
