
Figure 1.
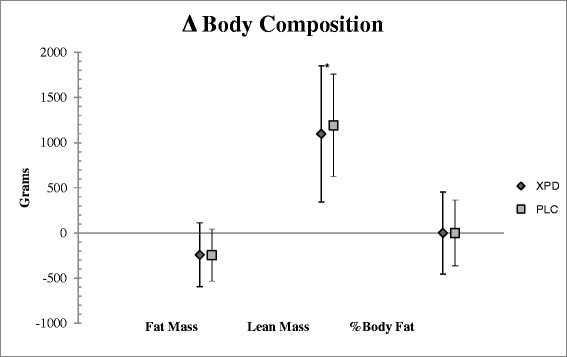
Body composition measures. Change in body composition measures from baseline values. Lean Mass was significantly increased for PLC and SUP from baseline to final testing. There were no significant changes for Fat Mass. *indicates a significant time effect (p ≥ 0.05).