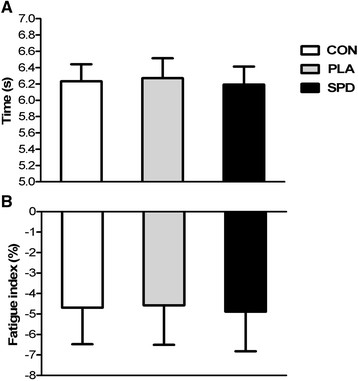
Figure 5.

Repeated sprint best time and fatigue index. Average (±SD) best performance for the 3 x 8.23 m repeated sprints in the 3 conditions (CON, PLA and SPD) (Panel A). Mean (±SD) fatigue index in the 3 conditions (Panel B). Fatigue index was calculated by the percent decrease in time between the fastest and the slowest sprints. Inter-group analysis was carried out using the Kruskal-Wallis one-way analysis; no statistically difference was found.
