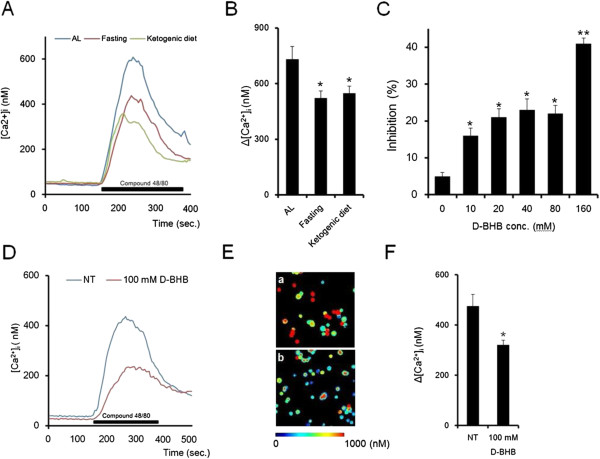
Figure 6.

Fasting and D-BHB suppress the RPMC [Ca2+]i mobilization response to compound 48/80. Time courses for [Ca2+]i responses of mast cells from fasting and the ketogenic diet (A). Values represent means (n = 12 aciner cells). Comparison of [Ca2+] i changes in response to compound 48/80 (B). RPMC prepared form each treatment were stimulated with 1 μg/mL compound 48/80 for 240 sec. Values are means ± SEM, n = 12 aciner cells, *P < 0.05 significantly different from ad libitium (AL). The effect of D-BHB on mast cell degranulation (C). Cells were preincubated with various concentrations of D-BHB for 10 minutes, and then incubated (10 minutes) with 1 μg/mL compound 48/80. Values are means ± SEM, n = 6 rats. Time courses for [Ca2+]i responses of mast cells treated with D-BHB (D). Values represent means (n = 12 aciner cells). E: Pseudo color [Ca2+]i images of non-treatment (a) and D-BHB treatment (b) mast cells activated by compound 48/80. The effect of D-BHB on [Ca2+]i changes in response to compound 48/80 (F). Cells were stimulated with 1 μg/mL compound 48/80 for 240 sec under 100 mM D-BHB. Values are means ± SEM, n = 6, * P < 0.05 significantly different from non-treatment (NT).
