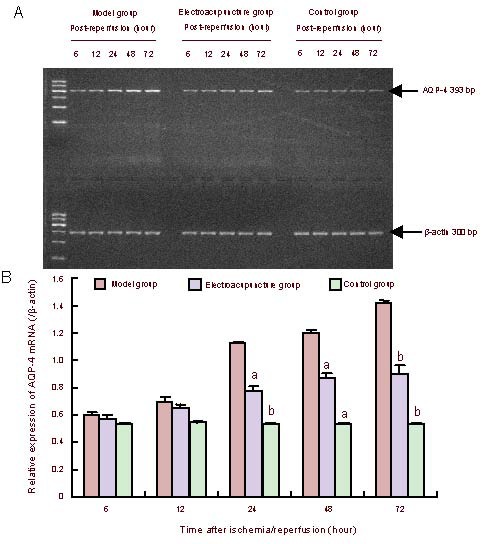
Figure 2.

Aquaporin-4 (AQP-4) mRNA expression in the rat corpus striatum.
(A) PCR of aquaporin-4 mRNA expression.
(B) Quantitative results of aquaporin-4 mRNA expression. The ratio of target band to internal reference gray value served as the protein expression intensity. Data are expressed as mean ± SEM. Four rats in the control group, six rats in the model group and six rats in the electroacupuncture group at each time point. Intergroup comparisons were conducted using one-way analysis of variance. aP < 0.05, bP < 0.01, vs. model group.
