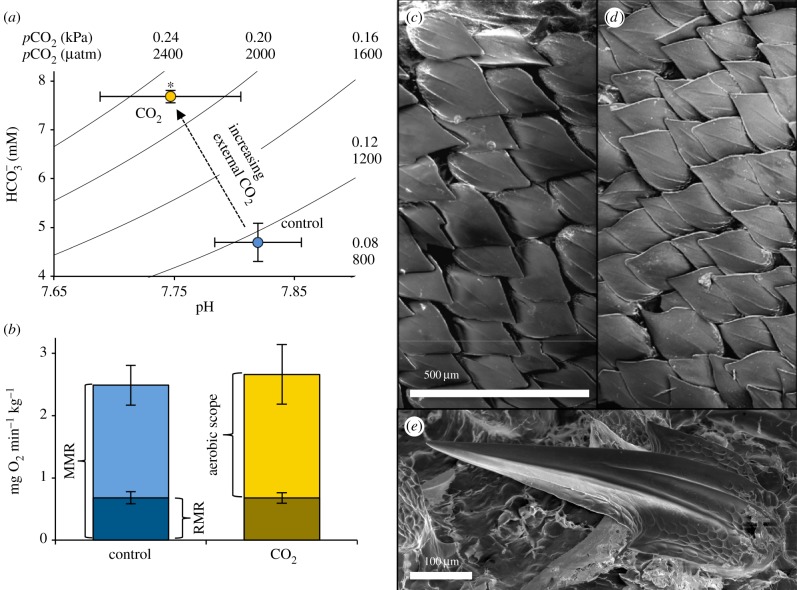
Figure 1.
Effects of pCO2 on the physiology of S. canicula. (a) Davenport diagram showing plasma  levels, pCO2 and pH after 4 weeks of exposure to control water (400 µatm CO2) or ocean acidification conditions (990 µatm CO2). Asterisks indicate a significant difference (p < 0.05). (b) Oxygen consumption rates. Control n = 7, CO2
n = 9. Resting metabolic rate (RMR), maximum metabolic rate (MMR) and aerobic scope are indicated by brackets. Denticle scanning electron micrographs showing control (c) and CO2-exposed (d) pectoral fin denticles from adults. Image (e) shows a single dorsal denticle from the CO2-exposed group with no visible damage or divergent growth. (Online version in colour.)

