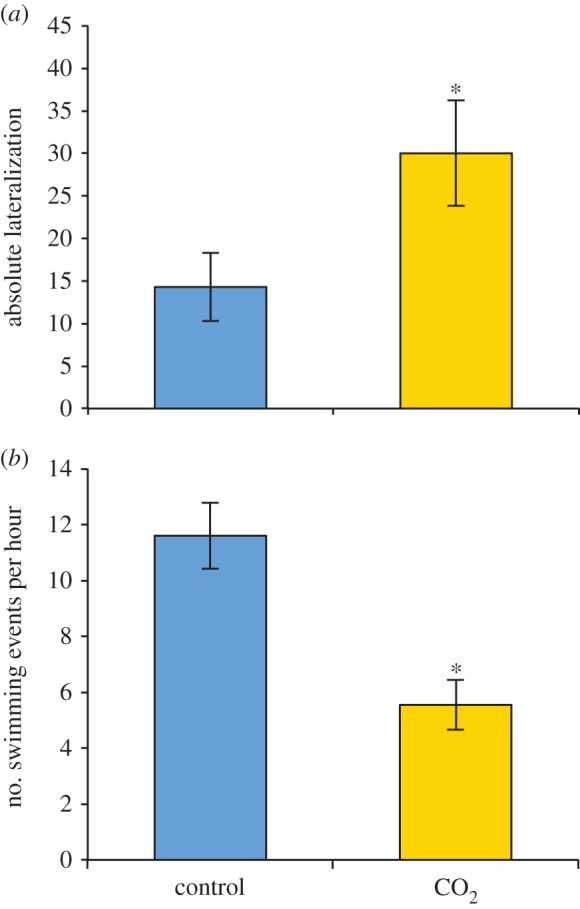
Figure 2.

Effects of pCO2 on the behaviour of S. canicula. (a) Absolute lateralization. Control n = 7, CO2 n = 10. The total average number of swimming events during the dark period is shown in figure (b). Asterisks indicate a significant difference (p < 0.05). Control n = 6, CO2 n = 5. (Online version in colour.)
