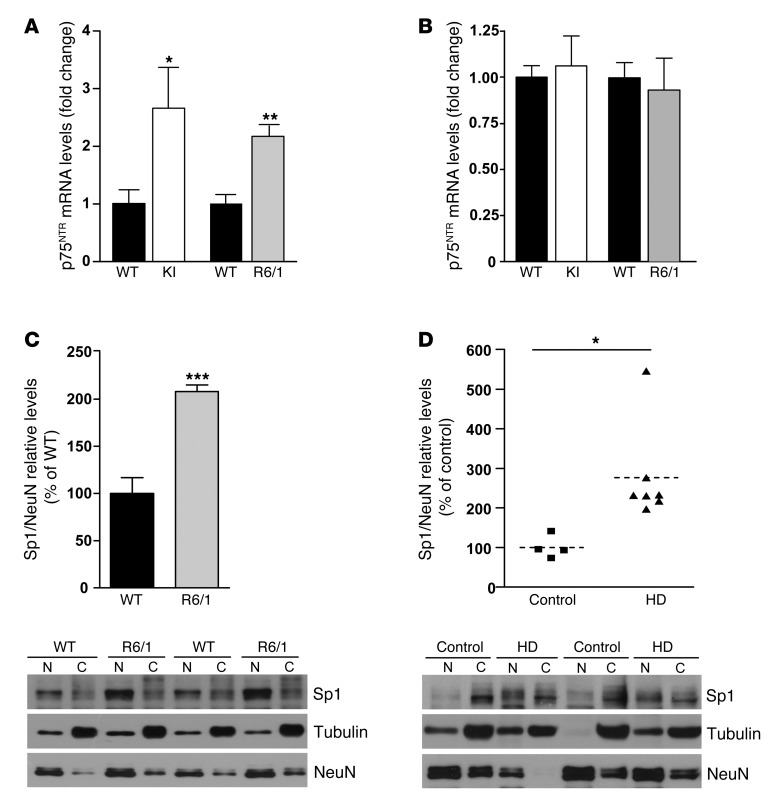
Figure 2. Increased hippocampal p75NTR mRNA expression associates with higher levels of Sp1 in the mouse and human HD hippocampus.
(A and B) Histograms showing p75NTR mRNA expression analyzed by RT-PCR in the hippocampus (A) and cortex (B) of 8-month-old WT and KI mice and 12-week-old WT and R6/1 mice. Results were normalized to 18S gene expression. Data represent mean ± SEM and are expressed as fold change. (n = 5–8 for each genotype.) (C and D) Western blot for Sp1 in nuclear and cytosolic enriched fractions from the hippocampus of WT and R6/1 mice at 14 weeks of age and from control and HD patients (n = 4–6). Representative immunoblots showing Sp1 protein levels in cytosolic (loading control α-tubulin) and nuclear (loading control NeuN) fractions. Data were analyzed by Student’s 2-tailed t test. *P < 0.05, **P < 0.01, and ***P < 0.001 compared with WT mice or control human samples.

