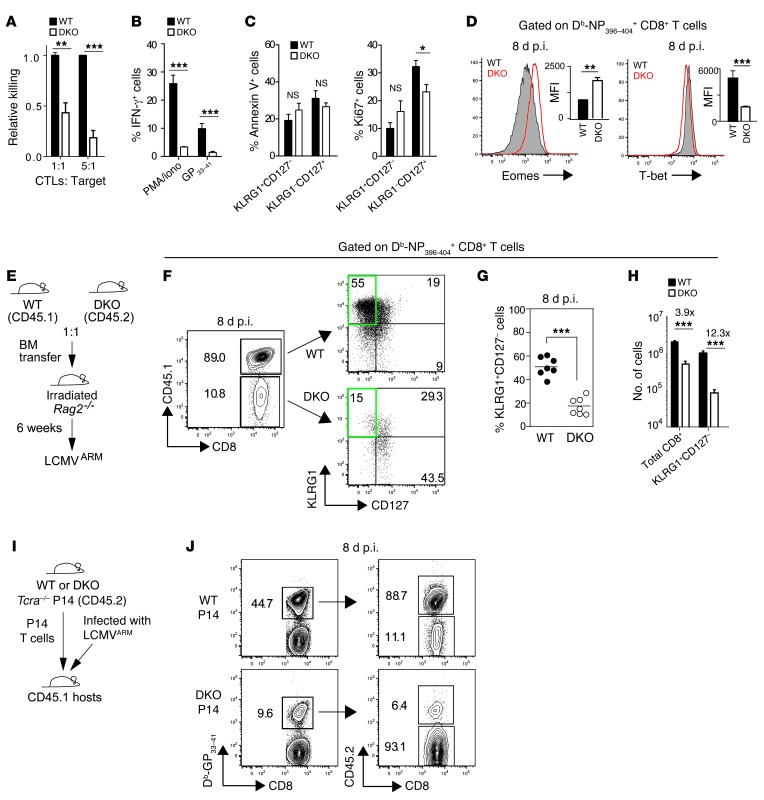
Figure 2. STIM1 and STIM2 regulate the function and differentiation of effector CD8+ cells.
(A) CD8+ cytotoxic CTLs from DKO P14 or WT P14 mice were cocultured with peptide-pulsed EL-4 cells; apoptosis was detected by annexin V staining. (B) Splenic CD8+ T cells from LCMVARM-infected WT (n = 6) and DKO (n = 5) mice were stimulated with PMA/ionomycin (iono) or GP33–41 peptide for 6 hours and IFN-γ production determined by flow cytometry. (C) Apoptosis and proliferation of LCMV-specific WT (n = 6) and DKO (n = 5) CD8+ T cells analyzed by annexin V and Ki67 staining. (D) T-bet and Eomes expression in CD8+ T cells from 3 mice per group. (E–H) Mixed BM chimeras were generated by reconstituting Rag2–/– mice with BM from WT (CD45.1) and DKO (CD45.2) mice and infected with LCMVARM (E). Frequency (F and G) and total number (H) of splenic effector CD8+ T cells of WT or DKO origin. Each dot in G represents 1 WT:DKO chimera; horizontal lines represent mean cell percentages. (I and J) Congenic CD45.1 WT mice were infected with LCMVARM and injected with 5 × 10⁴ CD8+ T cells from DKO P14 and WT P14 mice. (J) Left panels show percentages of DbGP33–41 tetramer+ CD8+ T cells; right panels show percentages of transferred versus host cells among LCMV-specific cells. Plots are representative of 4 mice per group. Statistical significance was calculated using Student’s t test (*P < 0.05; **P < 0.01; ***P < 0.001). Bar graphs in A–D and H represent the means ± SEM. Numbers in F and J represent the percentage of cells.

