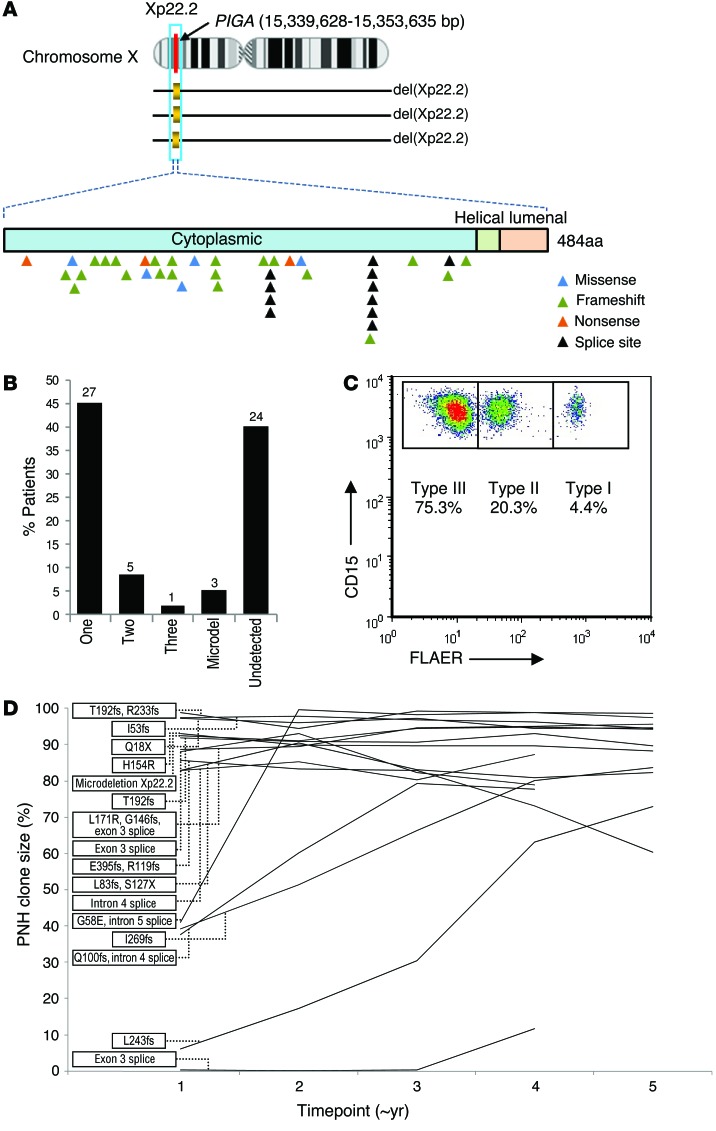
Figure 2. PIGA mutations and longitudinal analysis.
(A) Distribution of PIGA missense, frameshift, nonsense, splice site, and microdeletions. (B) Proportion and absolute number of patients with 1, 2, or 3 mutations as well as microdeletions and those patients with the PNH phenotype in which a PIGA mutation was not detected. (C) Representative flow cytometric plot quantifying the number of type I (normal), type II (intermediate GPI anchor loss), and type III (complete GPI anchor loss) cells. (D) Longitudinal flow cytometry quantifying the wbc PNH clone size in patients with approximately 4 years or more of follow-up (n = 16). Each time point corresponds to approximately 1 year.

