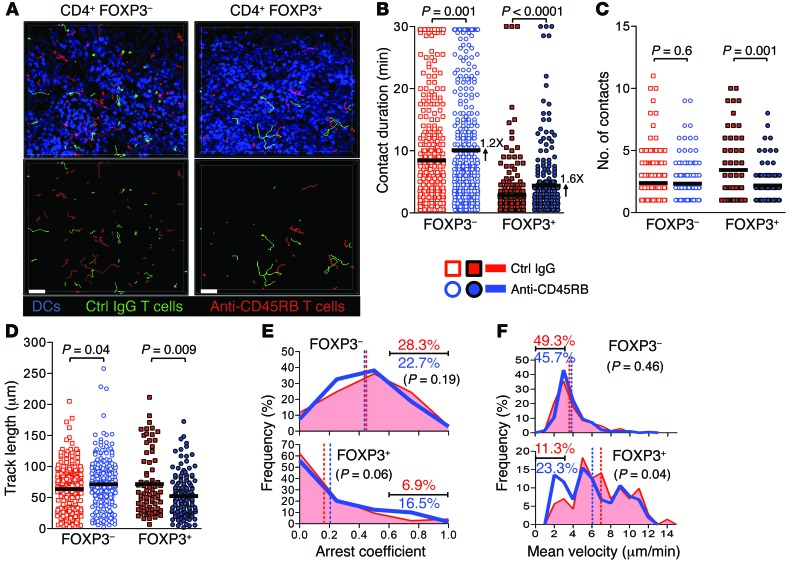
Figure 7. CD45 ligation enhances Treg/DC contacts in vivo.
Naive Cd11c-YFP mice received cotransfer of either FOXP3–CD4+ cells isolated on day 4 from mice treated with IgG or anti-CD45RB or FOXP3+CD4+ cells isolated on day 4 from mice treated with IgG or anti-CD45RB. (A) Representative cell tracks from 30-minute time-lapse images acquired by 2PIM of splenic red pulp 1 day after cotransfer of control IgG- or anti-CD45RB–exposed FOXP3–CD4+ or FOXP3+CD4+ cells. Images correspond to Supplemental Video 1. Bottom row shows cell tracks only (scale bar: 50 μm). (B–D) Quantification of motility and T cell/DC interactions from images in A. (B) T cell/DC contact duration time (numbers indicate fold increase vs. control IgG), (C) number of T cell/DC contacts per T cell track, (D) total traveled distance per track. Bars represent mean. (E and F) Cell tracks from images in A were analyzed (E) for arrest coefficient (fraction of time a T cell has an instantaneous velocity ≤2 μm/min over the entire tracking time) and (F) for mean velocity, and plotted as frequency distribution. Vertical dashed lines show mean, and numbers represent percentages of tracks with a value of ≥0.6 (E) and a value of ≤3 μm/min (F) within each group. P values compare fractions of control vs. anti-CD45RB–treated CD4 tracks within cutoffs defined above. n = 4 mice per group from 4 independent experiments. 213 control IgG FOXP3–, 199 anti-CD45RB FOXP3–, 72 control IgG FOXP3+, and 103 anti-CD45RB FOXP3+ tracks were analyzed from 11 time-lapse images per group.

