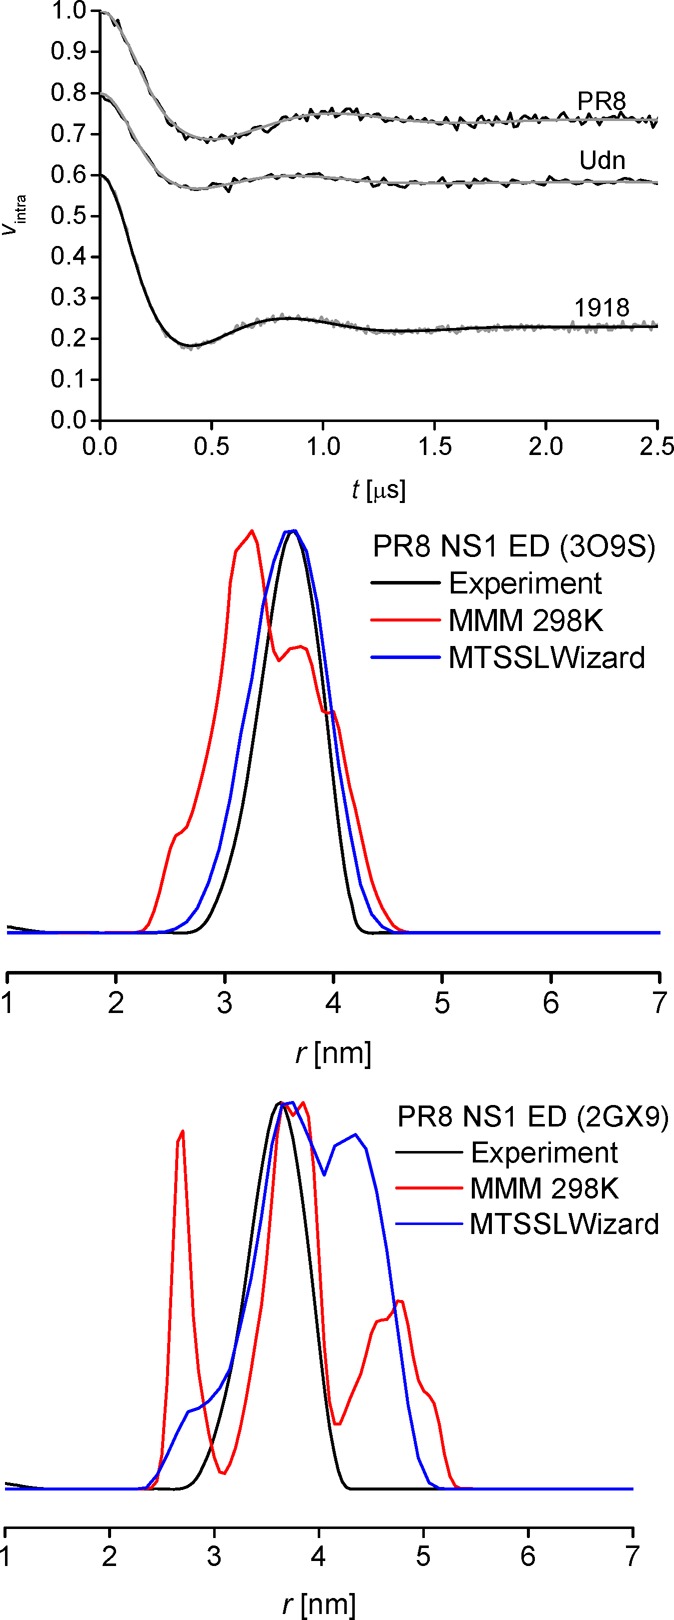
Figure 3.

Experimental PELDOR data (black) and fits (gray) on the NS1 ED of PR8, Udn, and 1918 (top). For clarity, traces and fits of Udn and 1918 have been shifted by −0.2 and −0.4 on the y-axis, respectively. Distance distribution for PR8 in comparison with crystal helix–helix (middle) and strand–strand (bottom) dimer models.
