Figure 8.

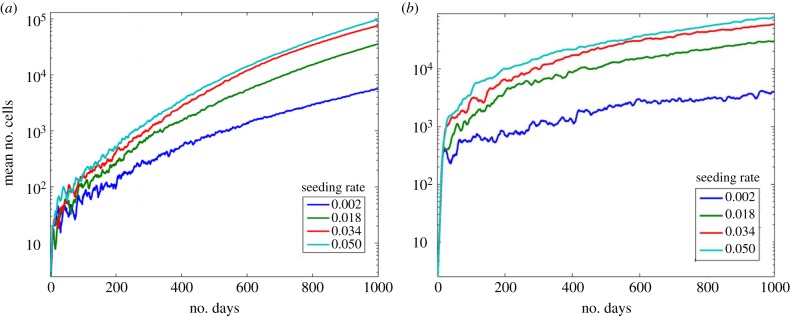
Effects of seeding location. The mean number of cells under stem cell seeding rates ps with seeding occurring randomly anywhere on the grid. (a) Here dmax = 6. (b) Here dmax = 12. (Online version in colour.)

Effects of seeding location. The mean number of cells under stem cell seeding rates ps with seeding occurring randomly anywhere on the grid. (a) Here dmax = 6. (b) Here dmax = 12. (Online version in colour.)