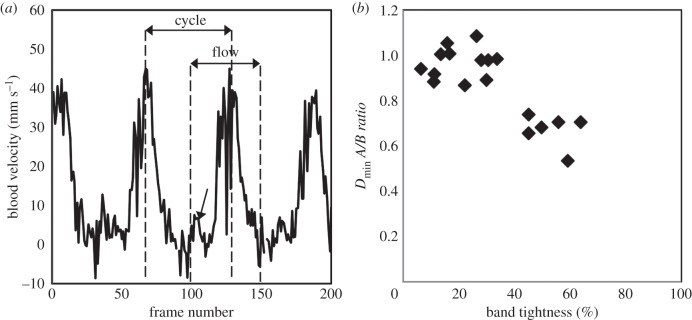
Figure 6.
Time of flow versus band tightness. (a) Blood flow velocity trace over approximately four cardiac cycles for an example NL embryo. The arrow designates the initial flow surge seen before the main flow of the cardiac cycle in loosely banded embryos. (b) OFT Dmin ratios at banding site (after/before banding) versus band tightness. Diameters were measured only from M-mode images which clearly showed the upper and lower myocardium walls (n = 18).

