
Figure 2.
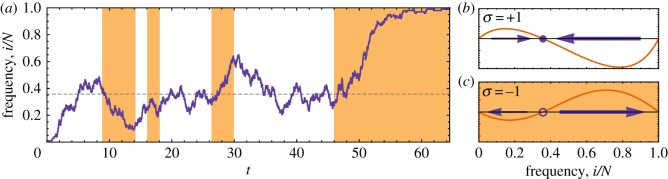
(a) A sample trajectory (time series) of the fraction of individuals of type A. White background corresponds to the environment being in the σ =+1 coexistence state, while the shaded background corresponds to the σ =−1 coordination state. Dashed line is the location of the point at which selection balances, which is the same in both states of the environment. (b) Gradient of selection in the σ =+1 coexistence state  . Solid circle shows location of the point of selection balance, and arrows indicate the direction and magnitude of flow towards this point. (c) Gradient of selection in the σ =−1 coordination state
 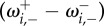 . Empty circle shows location of the point of selection balance, and arrows indicate the direction and magnitude of flow away from this point. For the realization in panel (a) and the selection bias shown in (b) and (c), the payoff matrix elements are aσ = dσ = 1, bσ = 1 + 0.5σ and cσ = 1 + 0.9σ, the system size is N = 100, the selection intensity is β = 1, and the switching probabilities are p+ = 10−3 and p− = 10−4. (Online version in colour.)