Figure 3.
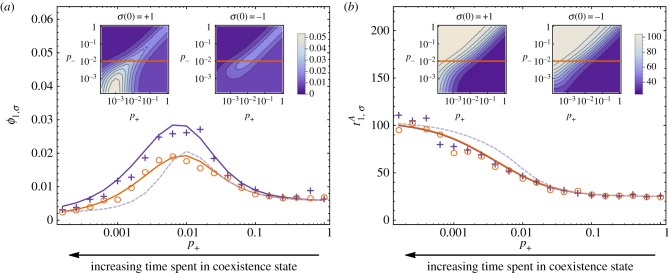
(a) Fixation probability of a single mutant as a function of switching probabilities. The main panel shows simulation results (symbols; crosses correspond to σ(0) = +1 and circles to σ(0) =−1) for fixed p− = 0.01, along with the exact theoretical results (solid lines) from equation (4.4), and the effective theoretical result (dashed line) of equation (4.10). Inset panels show fixation probabilities from equation (4.4) over all combinations of p+ and p−. Left inset panel: initial condition σ(0) = +1. Right inset panel: σ(0) =−1. The horizontal lines correspond to the data shown in the main panel. (b) Mean conditional fixation time (in generations) of a single mutant as a function of switching probabilities. The main panel shows simulation results, as described above, for fixed p− = 0.01, along with the exact theoretical results (solid lines) of equation (4.8), and the effective theoretical result (dashed line) of equation (4.12). Inset panels show mean conditional fixation times from equation (4.8) over all combinations of p+ and p−. Left inset panel: initial condition σ(0) = +1. Right inset panel: initial condition σ(0) =−1. The horizontal lines correspond to the data shown in the main panel. The payoff matrix elements are aσ = dσ = 1, bσ = 1 + 0.5σ and cσ = 1 + 0.9σ, the system size is N = 50, and the selection intensity is β = 0.5. (Online version in colour.)

