
Figure 4.
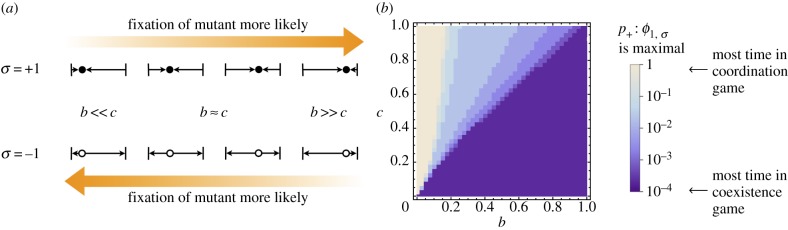
(a) Illustration of selection bias in the two environments for different locations of the balance point; (b) value of p+ at which ϕ1,σ is maximal given p− = 0.01 as a function of b and c. Remaining parameters are β = 0.5 and N = 50. (Online version in colour.)