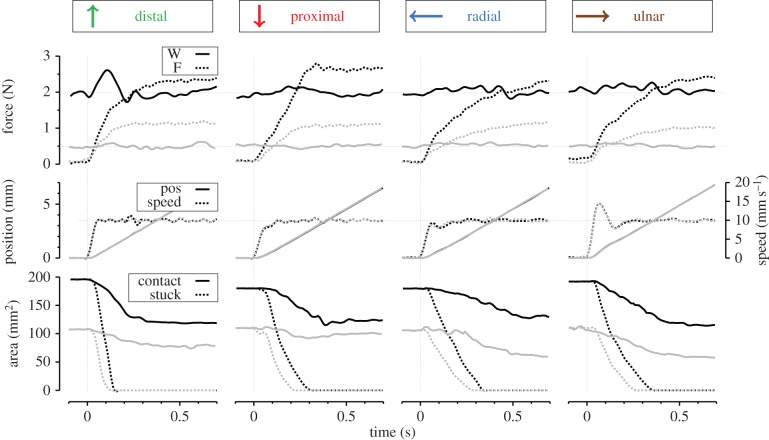
Figure 4.
Individual trials in each direction from subject S3 at a speed condition of 10 mm s−1. Panels show the time evolutions of the contact forces (top), stimulus position and speed (middle), and finger contact area (bottom). Trials are aligned to the stimulus onset (thin vertical dashed lines). For each direction, two traces are presented: for a trial at high normal force (2 N, in black) and low normal force (0.5 N, in grey). In the top panel, solid lines represent normal force and dashed lines represent tangential force. In the middle panel, solid lines represent position of the stimulus and dashed lines represent speed. In the bottom panel, solid lines represent contact area and dashed lines represent stuck area. Stimulus directions (D, P, R and U) are relative to the fixed fingertip (figure 1). (Online version in colour.)

