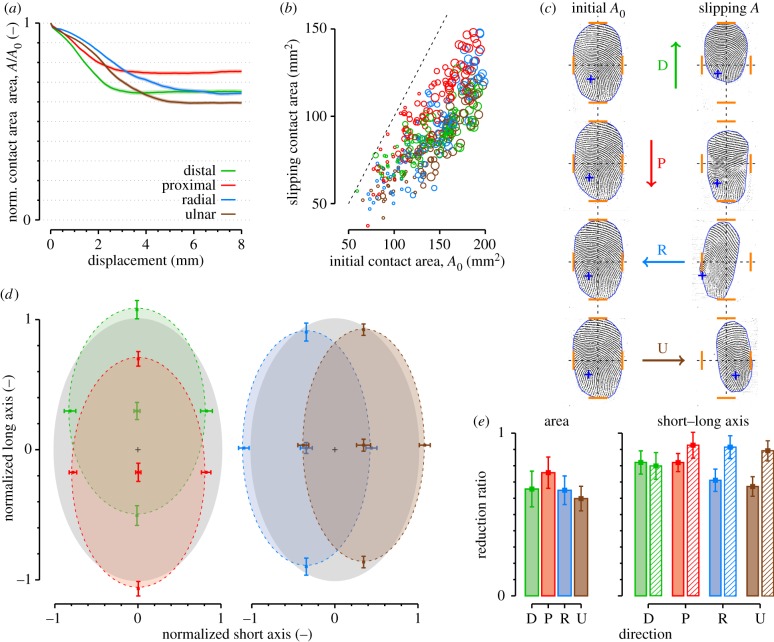
Figure 5.
(a) Evolution of the contact area as a function of stimulus displacement. Solid lines are means among all trials. Shaded areas represent standard error. (b) Scatter plot of initial contact area versus slipping contact area during steady-state slipping. Circle sizes correspond to the three normal force conditions (0.5, 1 and 2 N). Direction of movement is represented by different colours. Dashed line represents equal contact areas (slope = 1). (c) Example images of the initial contact area (left) and slipping contact area (right) in each direction (D, P, R and U) from subject S3. Orange dashes report external limits (top, bottom, left and right) of the initial contact and a blue cross is attached to the papillary whorl. (d) Normalized shape of the contact region. Left: proximal and distal. Right: radial and ulnar. Grey ellipse represents normalized initial contact area. Coloured ellipses represent mean contact region during slipping. Central cross represents mean geometrical centre. Four corner points represent mean external borders of the contact area. Error bars represent standard deviation. (e) Reduction ratios between initial contact area and slipping contact area. Right panel: Shaded bars represent short axis, hatched bars represent long axis. Error bars represent the standard deviation.

