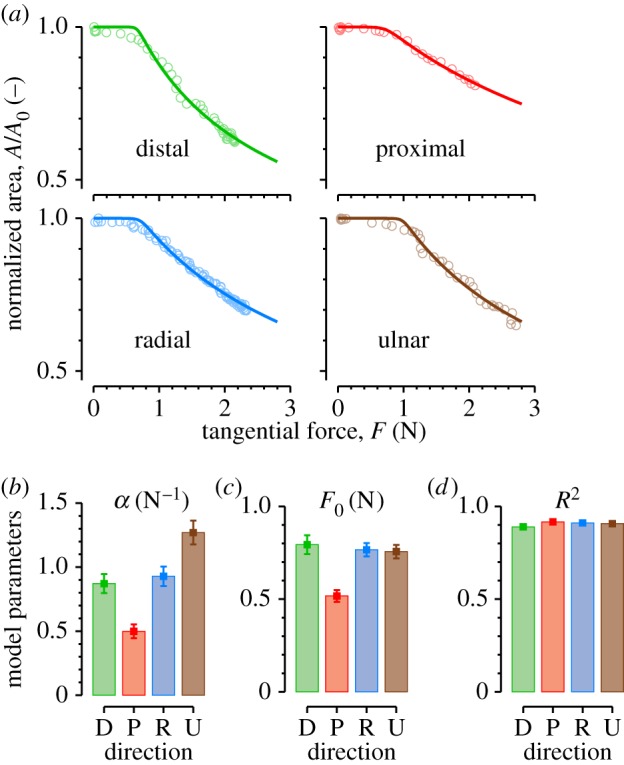
Figure 6.

Evolution of the contact area with tangential force. (a) Typical traces for each direction from subject S2. Dots are data and lines represent best fit. Mean of best-fit parameters to equation (3.1), (b) α, (c) F0 and (d) coefficient of determination R2 pooled across all trials. Error bars correspond to standard error. Colours represent directions.
