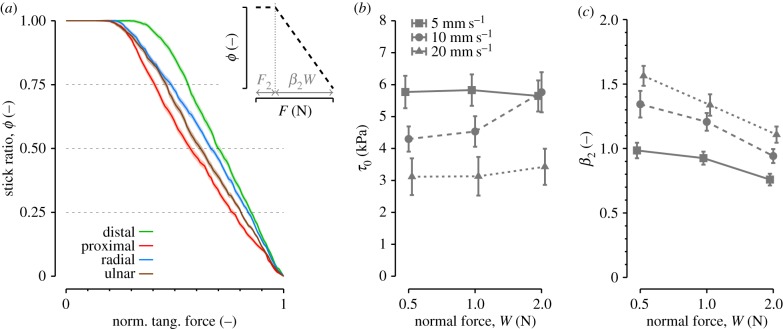
Figure 7.
(a) Evolution of the stick ratio as a function of the normalized tangential force. Solid lines are means across all trials. Shaded areas represent standard error. (b,c) Variation in the estimated interfacial shear strength, τ0, (b) and slope parameter, β2, (c) as a function of the normal force and speed, all directions pooled. Error bars represent the standard error across trials.

