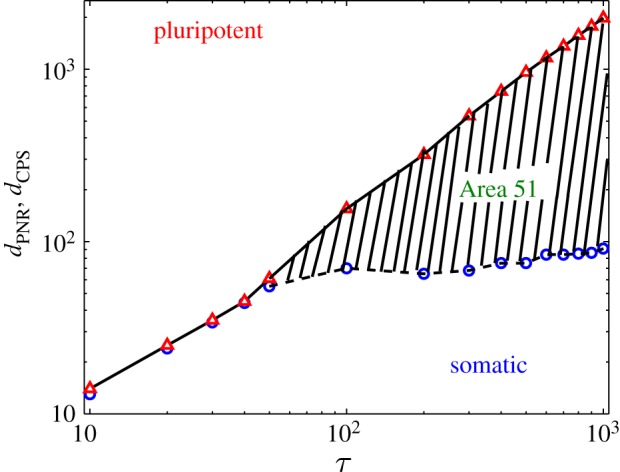
Figure 4.

Phase diagram showing regions where somatic and pluripotent states are stable as a function of the delay time τ. The phase boundaries indicating point of no return (circles (blue) and dashed line), dPNR, and those committed to the pluripotent state (triangles (red) and solid line), dCPS are indicated. The region between the two states marks the region when the cell fate attains neither fixed point, but oscillates indefinitely, termed ‘Area 51’ [10]. (Online version in colour.)
