
Figure 5.
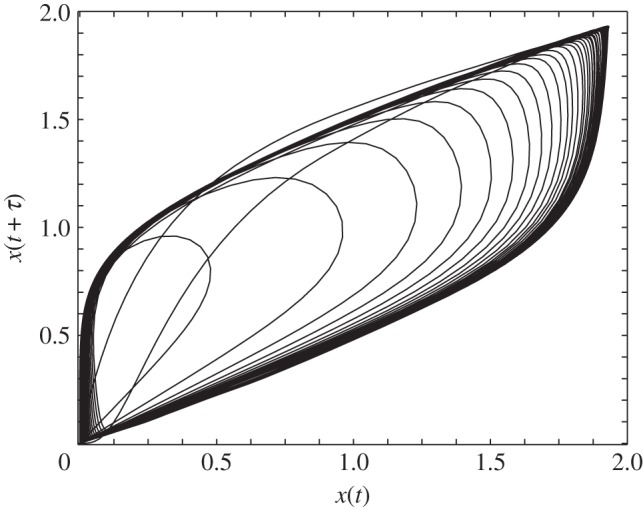
Phase diagram of the expression level of the gene x(t) as a function of its delayed response x(t + τ). Limit cycle behaviour for the genetic circuit for delay parameters d = 500 for the chemical drive and τ = 500 for the positive chemical feedback in equation (2.2).